
VYNN researchNasdaq: NVDARun of 3 Oct 2026
NVIDIA
fair value
On 3 Oct 2026, VYNN’s model valued NVIDIA at $350.82 a share, 50.0% above the $233.95 price. A Strong Buy, published with low confidence.
A dated research record. It does not update, and it is not investment advice.
- Price at the run
- $233.95
- VYNN fair value, 50.0% above the price
- $350.82
- Analysts' mean target, 59 analysts
- $327.70
- Rating, low confidence
- Strong Buy
Price, model and analysts on one scale.
The two methods give $331.37 and $370.28. Their midpoint is the fair value. The price at the run sits below both.
52-week range$164.27 to $237.87
VYNN’s two methods$331.37 to $370.28
59 analysts’ targets$180.00 to $515.00
In VYNN’s rules a Strong Buy is a fair value 30% or more above the price; NVIDIA’s is 50.0% above. Confidence is low because both methods rest on one cash-flow forecast, and no independent peer-multiple method was available in this run.
What $233.95 asks of NVIDIA.
A price is a forecast. This is the growth the market was paying for at the run.
At this price, revenue would have to grow about 18% a year for 10 years at the modeled margins; on the same measure, the model's analyst-based forecasts come to about 24% a year.
Read the other way: to justify the price, the business needs terminal free cash flow of $485.93B. The model has $1,094.34B, so the market is asking for 55.6% less than the model expects.
Two methods, one forecast.
Both discount the same ten years of free cash flow. They differ in how they value what comes after.
Perpetual growth
$331.37 a share
After year ten, cash flow grows 2.5% a year for good.
- Present value of free cash flows
- $3,695.12B
- Terminal value
- $4,231.15B
- Enterprise value
- $7,926.27B
- Equity value
- $8,001.54B
Exit multiple
$370.28 a share
In year ten, the business is valued at 27.9 times EBITDA.
- Exit multiple (EV/EBITDA)
- 27.9x
- Terminal enterprise value
- $15,133.78B
- Enterprise value
- $8,865.88B
- Equity value
- $8,941.16B
Fair value, the midpoint of the two$350.82
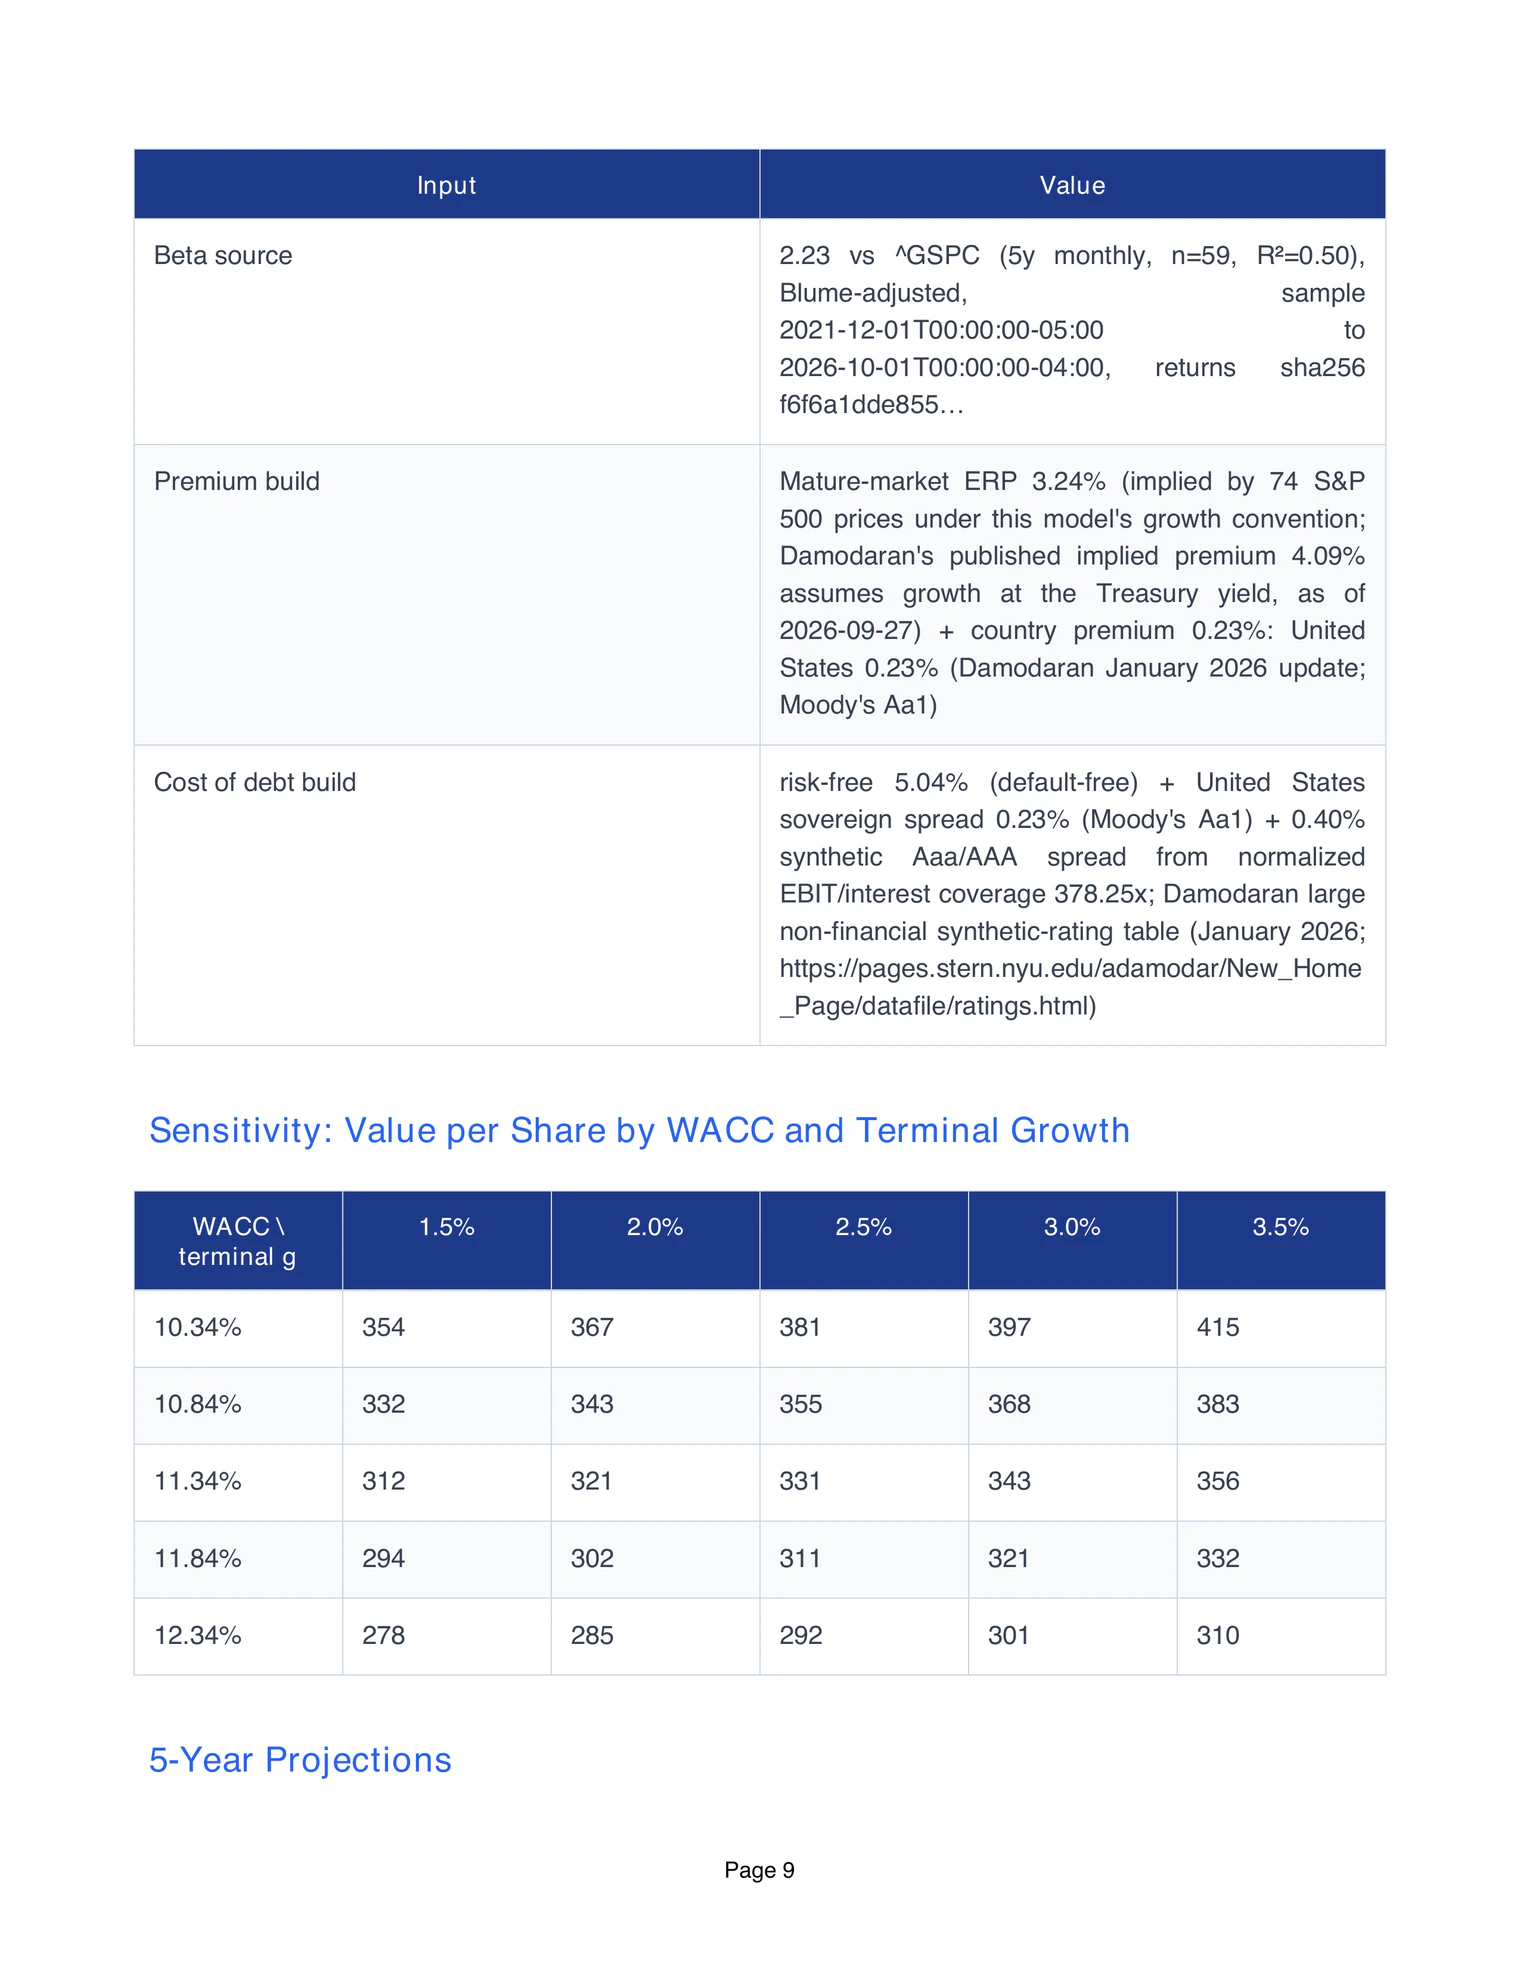
The cost of capital, built from published data
- Risk-free rate
- 5.04%
- US 10-year Treasury 5.28% (Yahoo, 2 Oct 2026), less the 0.23% US sovereign default spread (Moody's Aa1, Damodaran, Jan 2026)
- Equity risk premium
- 3.47%
- Mature-market premium 3.24%, implied by 74 S&P 500 prices, plus the 0.23% US country premium (Damodaran, Jan 2026)
- Levered beta
- 1.82
- 2.23 against the S&P 500 over 59 monthly returns, Dec 2021 to Oct 2026, Blume-adjusted
- Cost of equity
- 11.38%
- = risk-free + beta × premium
- Pre-tax cost of debt
- 5.68%
- Risk-free, plus the 0.23% sovereign spread, plus 0.40% for a synthetic AAA rating at 378.25x interest cover (Damodaran's rating table)
- Tax rate
- 14.19%
- Normalized cash tax rate, the same one used in the cash flows
- Equity weight
- 99.32%
- Market capitalisation over market capitalisation plus debt
- WACC
- 11.34%
- = equity cost × equity weight + after-tax debt cost × debt weight
What would change the answer.
The two assumptions a valuation leans on most, moved one step at a time.
| Cost of capital | Terminal growth | ||||
|---|---|---|---|---|---|
| 1.5% | 2.0% | 2.5% | 3.0% | 3.5% | |
| 10.34% | $354 | $367 | $381 | $397 | $415 |
| 10.84% | $332 | $343 | $355 | $368 | $383 |
| 11.34% | $312 | $321 | $331 | $343 | $356 |
| 11.84% | $294 | $302 | $311 | $321 | $332 |
| 12.34% | $278 | $285 | $292 | $301 | $310 |
The outlined cell is the model’s own case. Shaded cells are above the $233.95 price: 25 of the 25.
What the price and the analysts imply
| To arrive at | Cost of capital | or terminal growth |
|---|---|---|
| The model | 11.34% | 2.50% |
| The price, $233.95 | 14.37% | −6.77% |
| The analysts' mean target, $327.70 | 11.38% | 2.41% |
Each figure solves one assumption while the model’s cash flows and the other assumption stay fixed. A diagnostic, not a valuation.
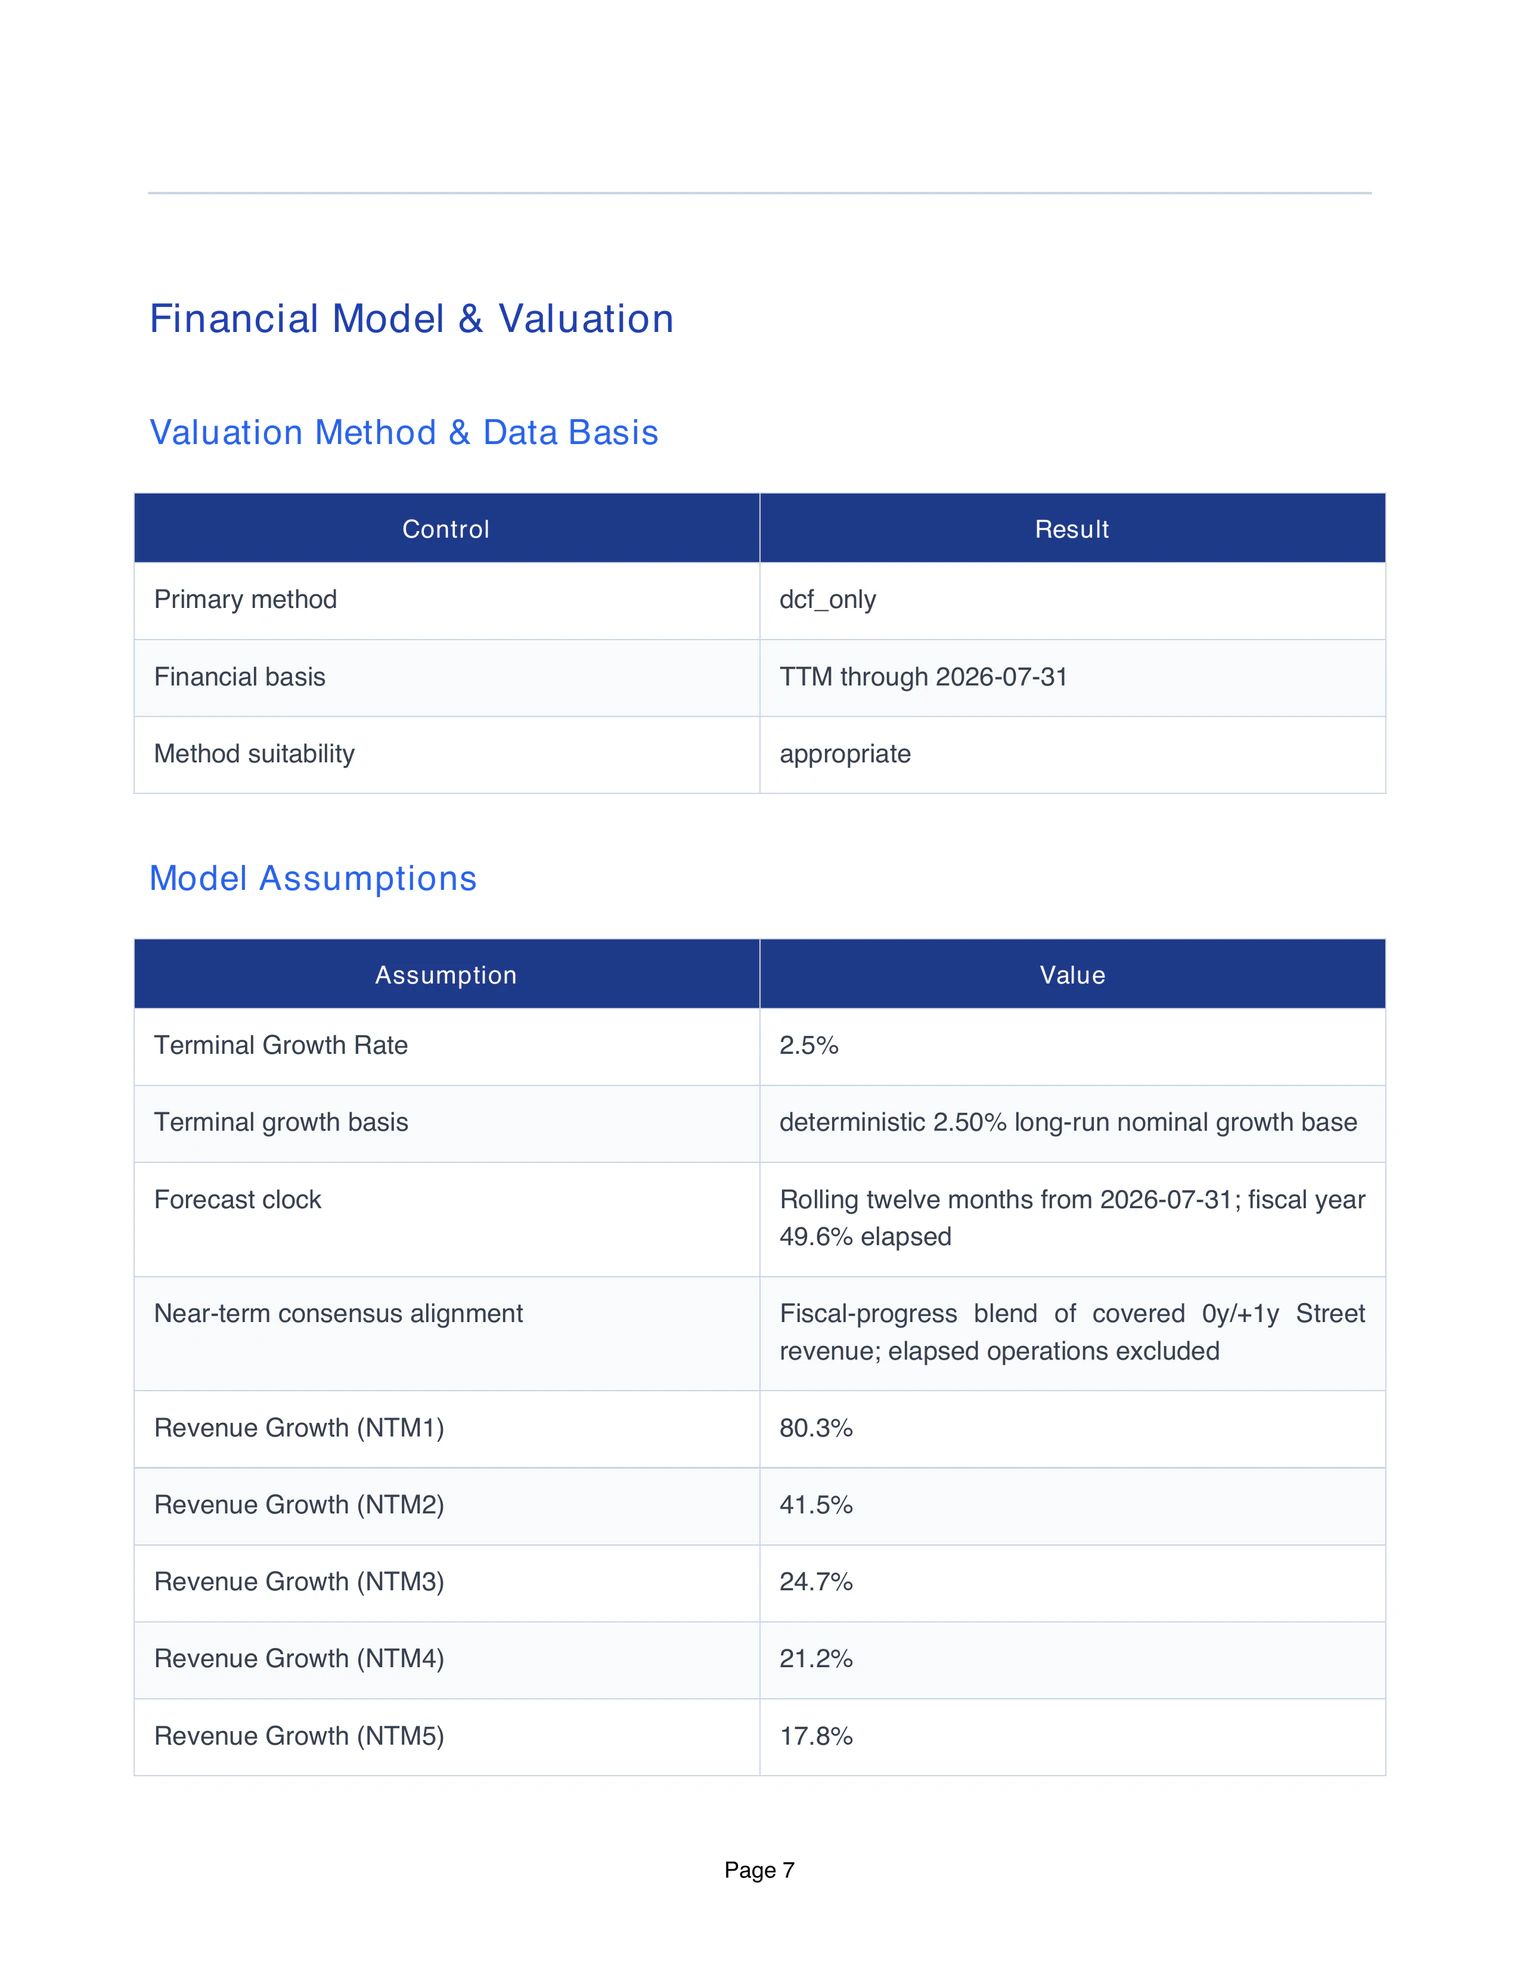
The forecast behind it.
Four reported years, then the first five of the ten the model projects.
| Year | Revenue | Growth | Free cash flow |
|---|---|---|---|
| FY2023 | $26.97B | $3.81B | |
| FY2024 | $60.92B | 125.9% | $27.02B |
| FY2025 | $130.50B | 114.2% | $60.85B |
| FY2026 | $215.94B | 65.5% | $96.68B |
| Year 1Forecast | $546.30B | 80.3% | $243.42B |
| Year 2 | $773.29B | 41.5% | $366.03B |
| Year 3 | $963.95B | 24.7% | $480.10B |
| Year 4 | $1,168.71B | 21.2% | $591.62B |
| Year 5 | $1,377.08B | 17.8% | $708.57B |
The reported years end 31 January. Forecast years run from 31 Jul 2026, so Year 1 grows from revenue over the twelve months to that date, $302.97B in the workbook, not from FY2026. The first forecast year matches analysts' revenue estimates (53 analysts) by design, which the report says is not independent validation.
What the news adds.
VYNN read 11 dated articles from the 90 days before the run, the newest from 17 Sep 2026, and classed the tone as neutral. The price target is the model’s fair value; the news is the evidence beside it.
Catalysts
NVIDIA expanded its open-source CUDA-Q platform with a logical-qubit orchestration layer and QUOPS benchmark, with reported use by Fermilab and other quantum ecosystem participants.
NVIDIA's reported high revenue growth, profitability, and free-cash-flow generation provide evidence of strong operating performance and financial capacity.
CEO Jensen Huang forecast that NVIDIA chip sales could approximately double in 2027, indicating management sees substantial continuing demand.
Risks
Huawei is accelerating its AI-chip roadmap and developing interconnects and clustered systems that could create a more credible domestic alternative to NVIDIA in China.
Optical supplier capacity expansion and product qualification may not keep pace with AI infrastructure demand, limiting the practical benefit of NVIDIA's commitments.
The $2 billion investment in Lumentum is a capital commitment whose direct financial return to NVIDIA is not established in the article.
NVIDIA's valuation multiples are elevated relative to some industry measures, leaving the stock exposed to multiple compression if growth expectations weaken.
AI-sector sentiment and concerns about risks from rapid AI development can trigger broad semiconductor share-price pressure, independent of company-specific operating results.
Each item is VYNN’s summary of dated articles, with the sources and quotations listed in the report’s appendix.
What VYNN checked before it published.
The value cleared the publication checks
The workbook's status reads Publishable: the deterministic valuation publication checks passed. Analysts' mean target points the same way as the model.
Confidence is stated as low, and why
The two methods share one cash-flow forecast, one discount rate and the same terminal economics, and no independent peer-multiple method was available. The report calls the result a scenario range, not an independently triangulated value.
Analysts' targets stay outside the value
Price targets and ratings are shown as a benchmark and are never averaged into the fair value. Analysts' revenue estimates do anchor the first forecast year (53 analysts), and the report says so.
Prose that could not be supported was left out
One claim in the written recommendation did not pass the claim-to-evidence check after rewrite attempts. The report omits that prose and prints the source headlines instead.
The files from this run.
Check any step, or change an assumption yourself.
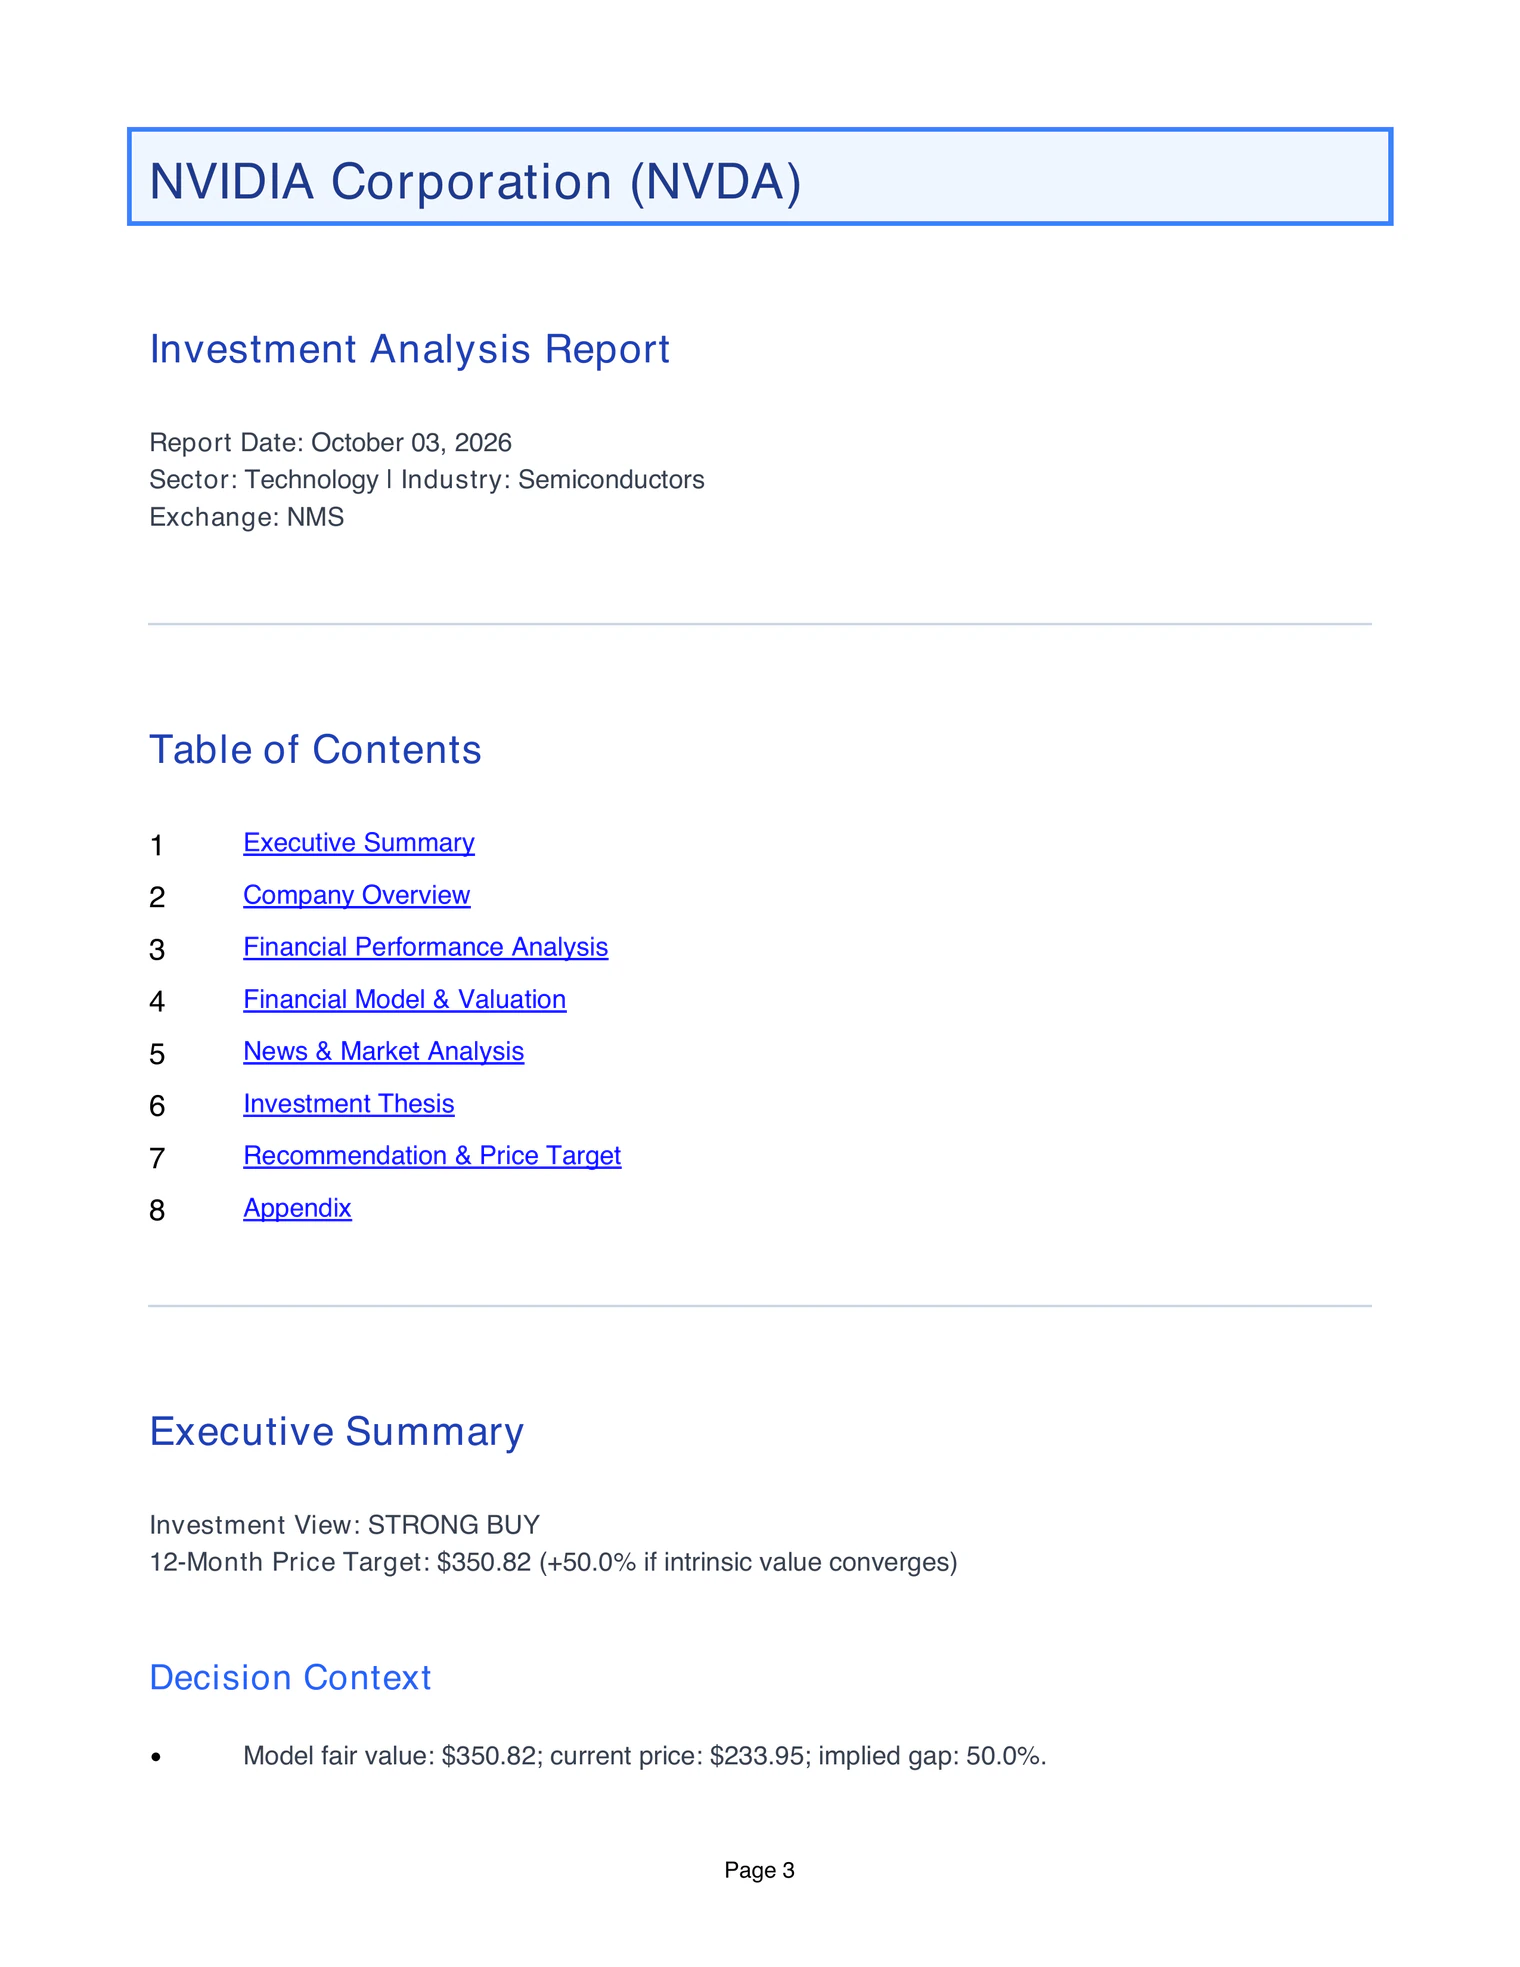
- The research reportPDF, 40 pages
- The financial modelExcel, 10 tabs with live formulas
- Engine valuation-2026-09-27.1. Generated 3 Oct 2026, 00:45 UTC.